San Francisco Violence Of Crime Prediction
Project Overview
This project analyzes 12(2003-2015) years of crime reports from across all of San Francisco’s neighborhoods to create a model that predicts the violence Of crime that occurs at a given time and location.
Problem Statement :
San Francisco is a major city, so many visitors read about crime in San Francisco and wonder how safe it is to travel to. Visitors want to have a great experience when they travel to San Francisco. Crime is a social phenomenon; there will never be a society free from crime. Societies always look for a way to minimize it and prevent it, by predicting the violence of crime in San Francisco it will be less likely to occur by taking the necessary care for and with a few safeguards, people can enjoy the city without undue worry.
Workflow:

1.Data acquisition:
This dataset contains 878,049 incidents derived from the SFPD Crime Incident Reporting system. The data ranges from 1/1/2003 to 5/13/2015.”This dataset is brought by SF OpenData, the central clearinghouse for data published by the City and County of San Francisco.”
- Downloaded from: https://www.kaggle.com
- Provided by: SF OpenData and Kaggle
Features:
- Dates
- Crime Category
- Descript
- Day Of Week
- PdDistrict
- Resolution
- Address
- X (Longitude)
- Y(Latitude)
2.Data Cleaning
In this step, the outliers for X, Y was removed to be within the boundaries of San Francisco , use Label Encoder for categories and add the violent binary column based on the type of crime category.
3.Exploratory Data Analysis (EDA):
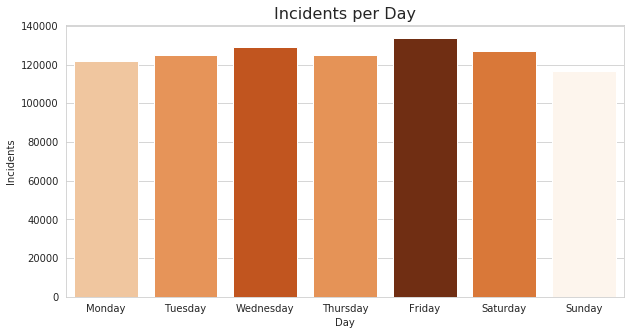
The incidents per day figure shows the the volume seems to be fairly constant with slight bump upon the weekend
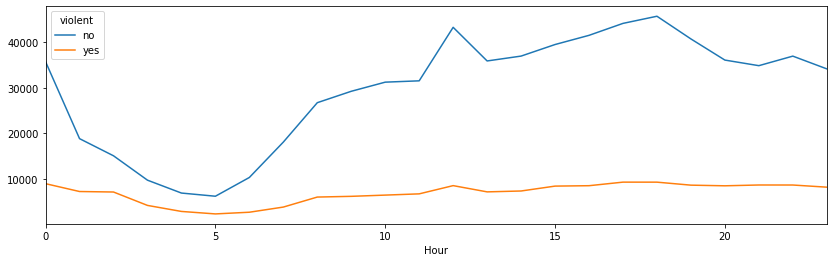
When looking at incidents per hour there is a reasonable dip in the sleep early morning hours between 1 -8 am , then picks up and holds steady.
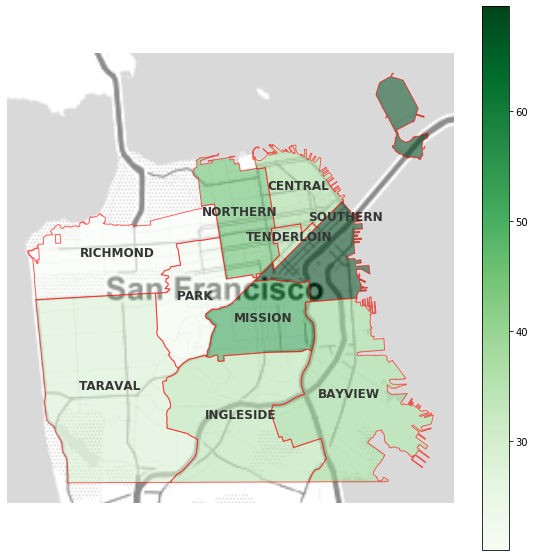
The map shows the density of crimes in all districts in the city, Clearly, there are significant variations between the different districts of the City with the Southern district having the most incidents followed by Mission and Northern.
4.Building models:
In this step, Some Features Engineering has to be done, Data Scaling using Min-max scalar, Use the Random Under sampling technique for the imbalance class and Split the Dates field to Year, Day, hours, minutes, and seconds.
5.Selecting Best models:
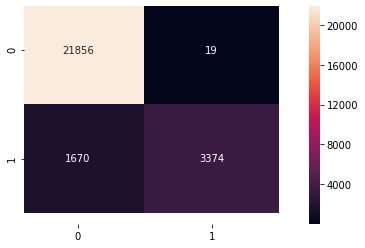
RandomForest Classifier has been selected with hyperparameters : n_estimators = 100 , Max Depth =4 , with accuracy =0.94 and recall =0.67
5.2 Confusion matrix
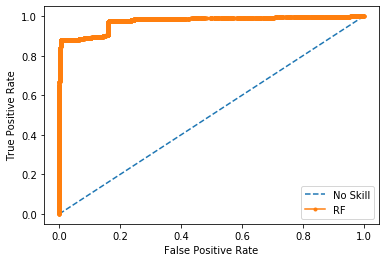
5.3 ROC
The Model perform well , the curve is great near to 1